Mathematica基础——RegionPlot的用法(1)
1、 RegionPlot[不等式,{x,xmin,xmax},{y,ymin,ymax}——作出“不等式”代表的区域. 举个例子,作出不等式x^2 + y^3 < 2&&-2<x,y<2所代表的区域:RegionPlot[x^2 + y^3 < 2, {x, -2, 2}, {y, -2, 2}]

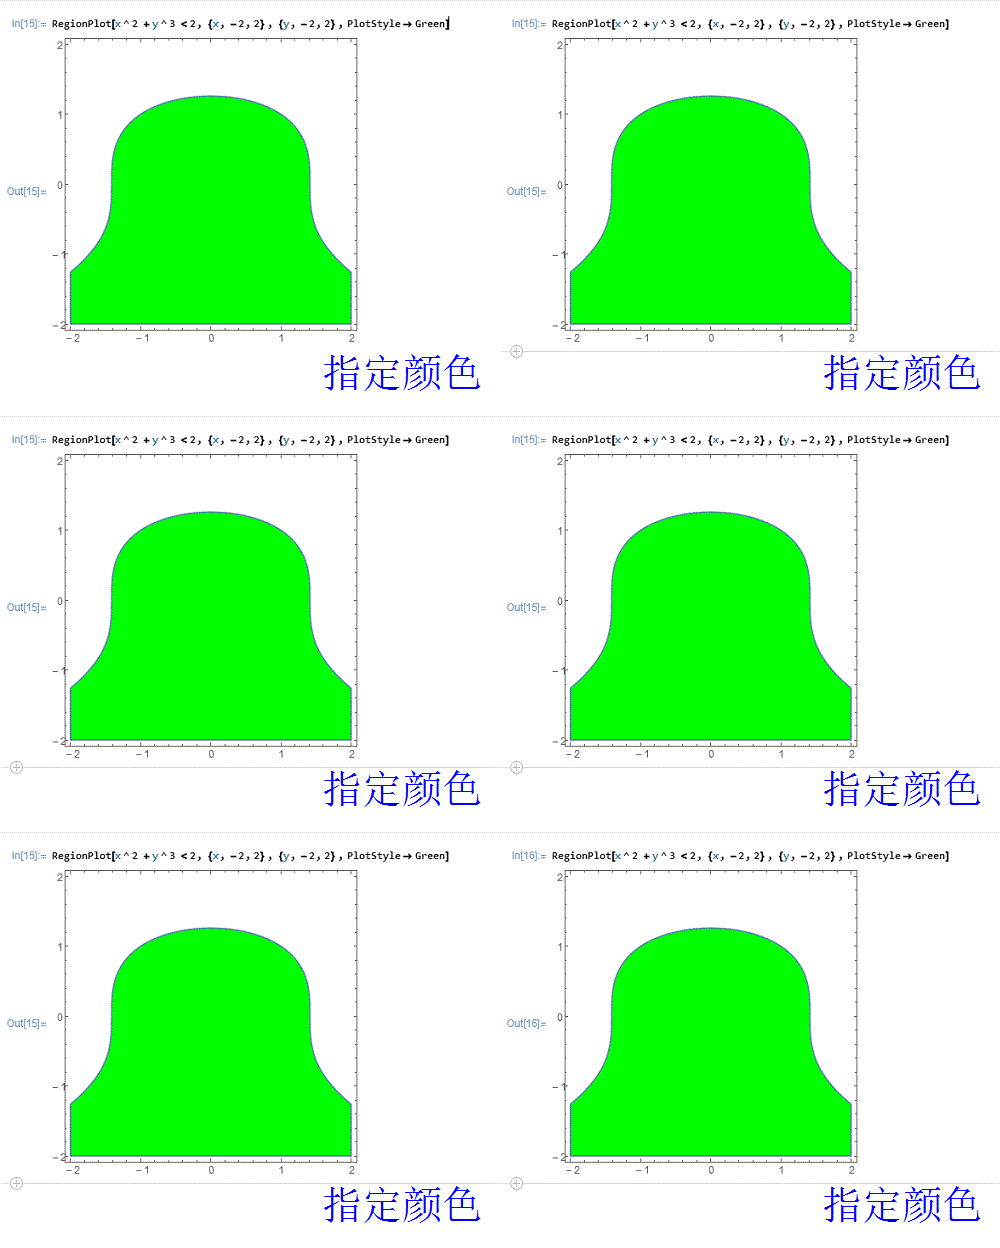
2、 指定区域的颜色:RegionPlot[x^2 + y^3 < 2, {x, -2, 2}, {y, -2, 2},PlotStyle->Green]

3、 改变区域边界的颜色:RegionPlot[x^2 + y^3 < 2, {x, -2, 2}, {y, -2, 2},BoundaryStyle ->Red,PlotStyle->Green]

4、 给图像加上“标签”:RegionPlot[x^2 + y^3 < 2, {x, -2, 2}, {y, -2, 2}, Epilog -> Text["x^2+y^3<2", {0, 0}, {- 1, 1}]] Epilog,百度翻译的结果是“结语,尾声,收场白”。

5、 画出不等式组代表的区域:RegionPlot[x^2 + y^3 < 2 && x + y < 1, {x, -2, 2}, {y, -2, 2}]RegionPlot[x^2 + y^3 < 2 && x + y > 1, {x, -2, 2}, {y, -2, 2}]


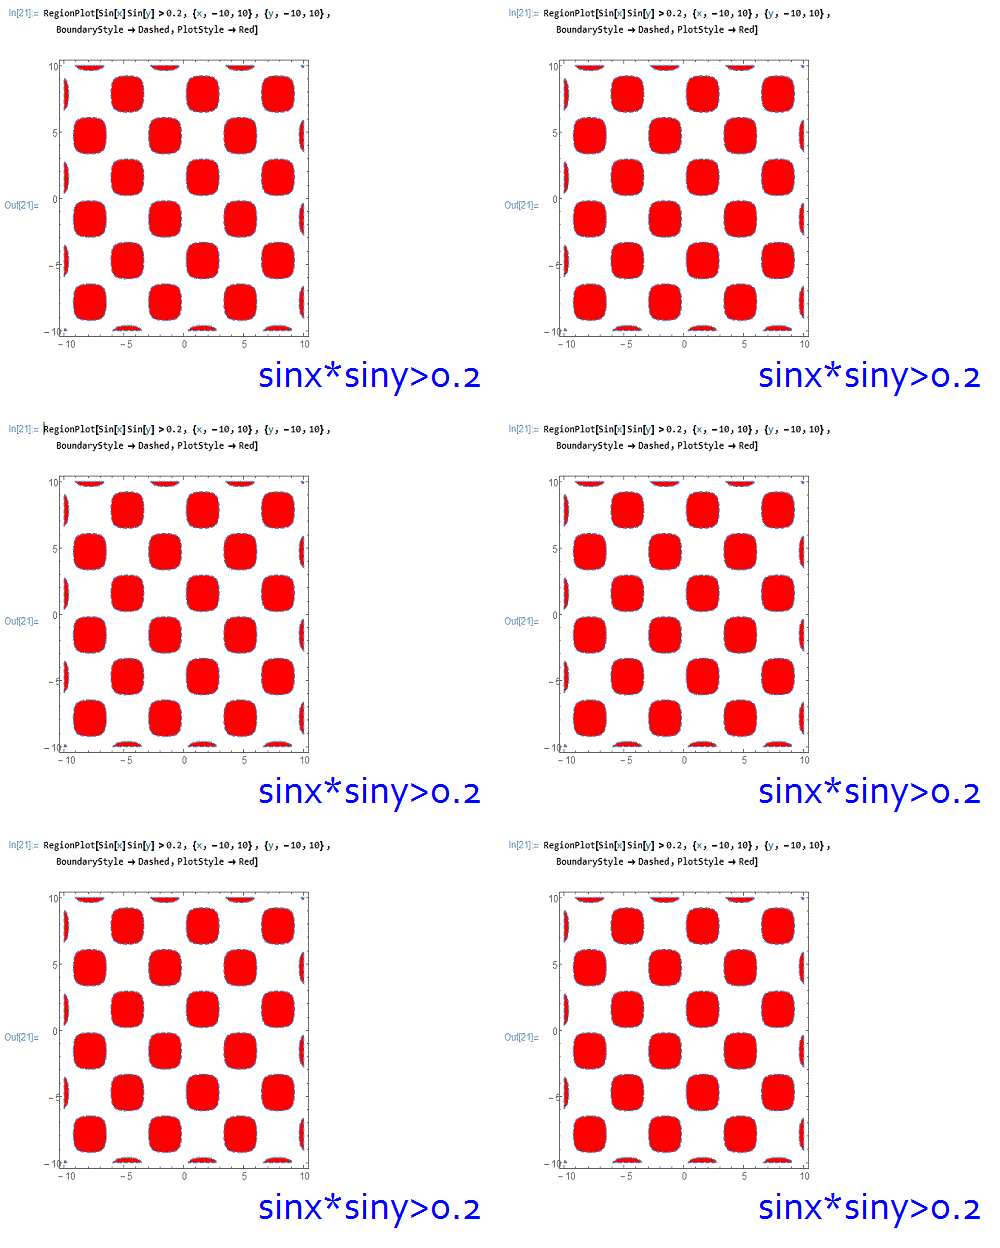
6、 画出sinx*siny>0.2代表的区域:RegionPlot[Sin[x] Sin[y] >0.2, {x, -10, 10}, {y, -10, 10}, BoundaryStyle -> Dashed, PlotStyle -> Red]

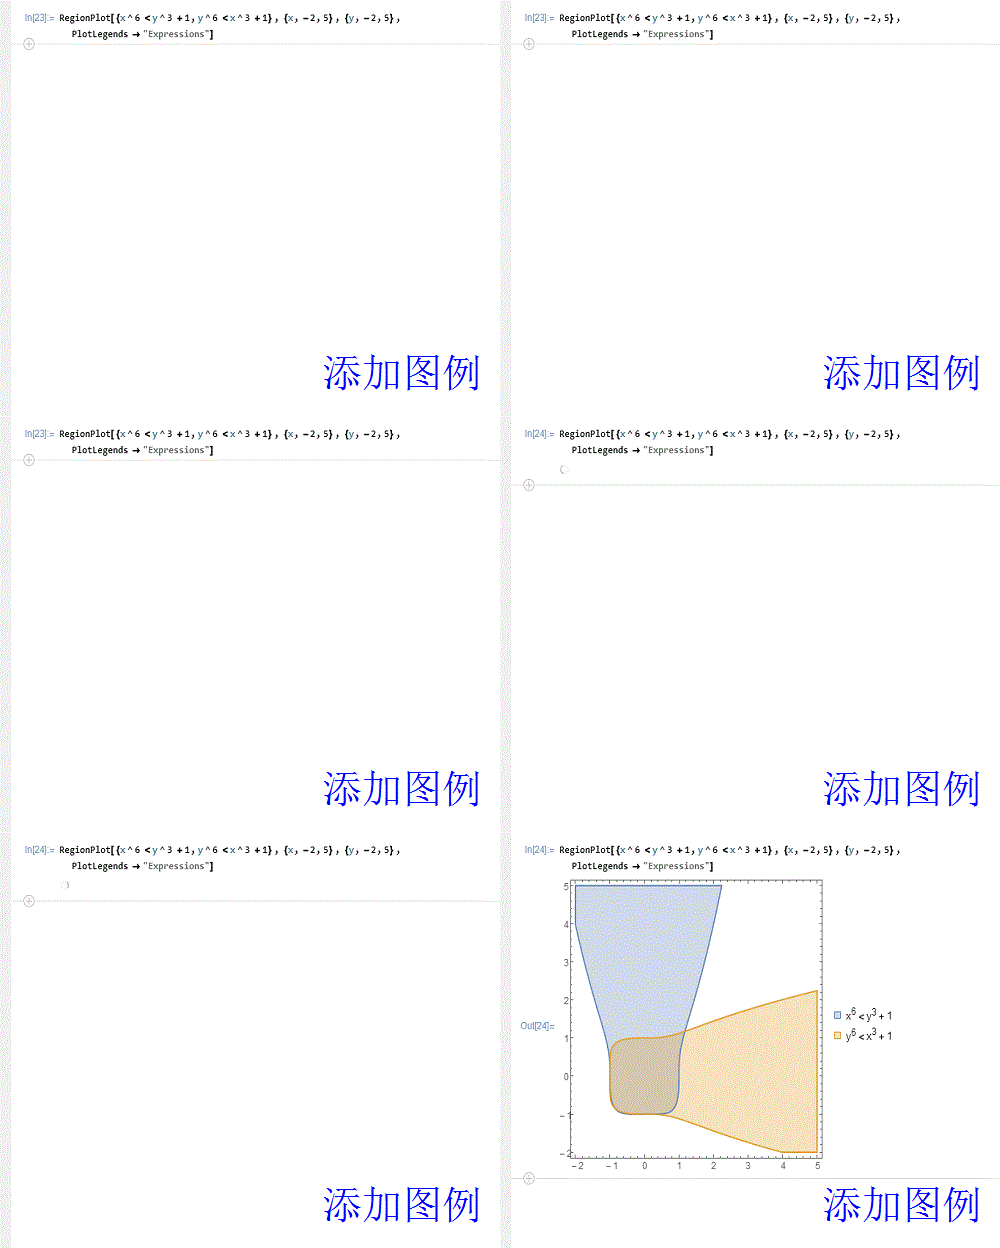
7、 给不同区域添加图例:RegionPlot[{x^6 < y^3 + 1, y^6 < x^3 + 1}, {x, -2, 5}, {y, -2, 5}, PlotLegends -> "Expressions"]
