Excel中使用rept函数做图表
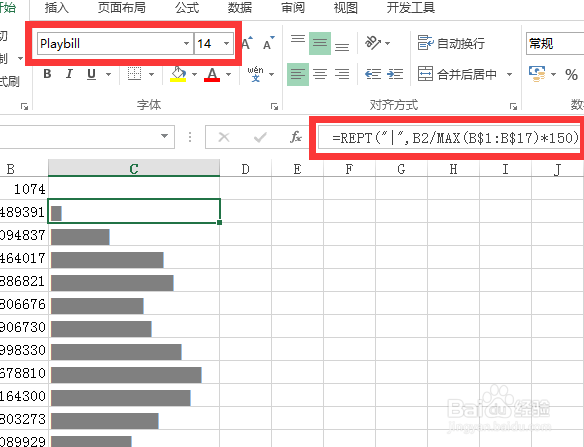
1、如何使用repth函数做柱形图。
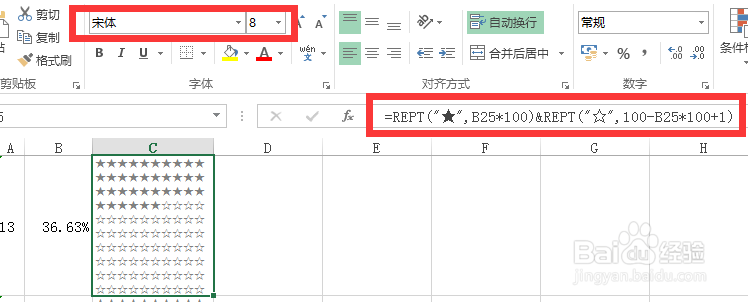
在C列输入下图中的公式,然后设置字体。
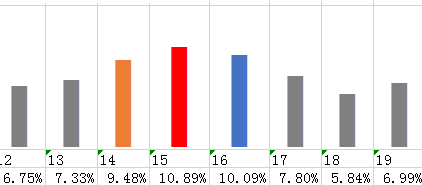
2、如果你想达到下图的效果
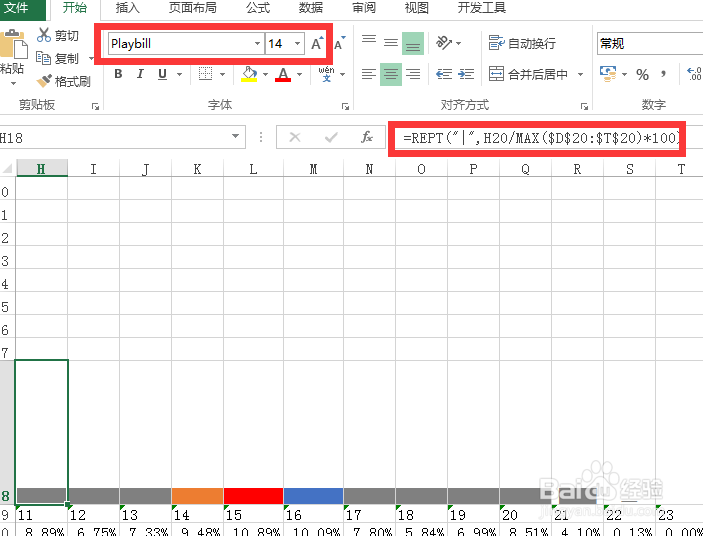
3、先按行输入下图公式,然后设置字体格式
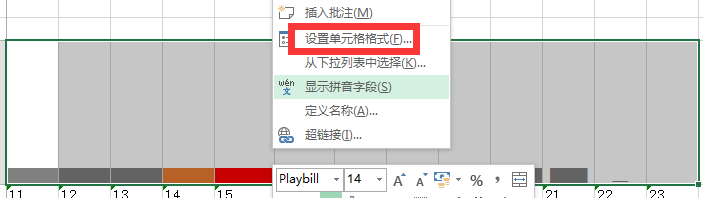
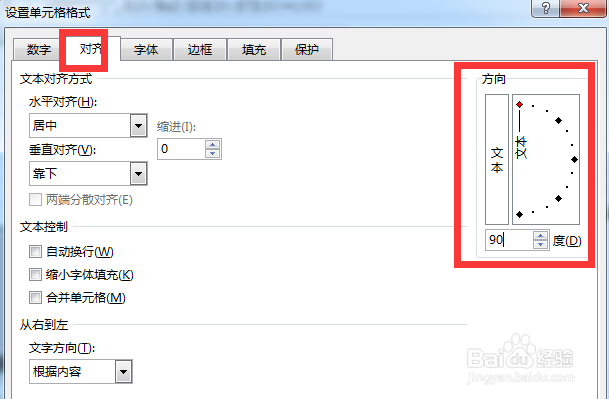
4、然后设置单元格格式-对齐-文本方向设置为90度
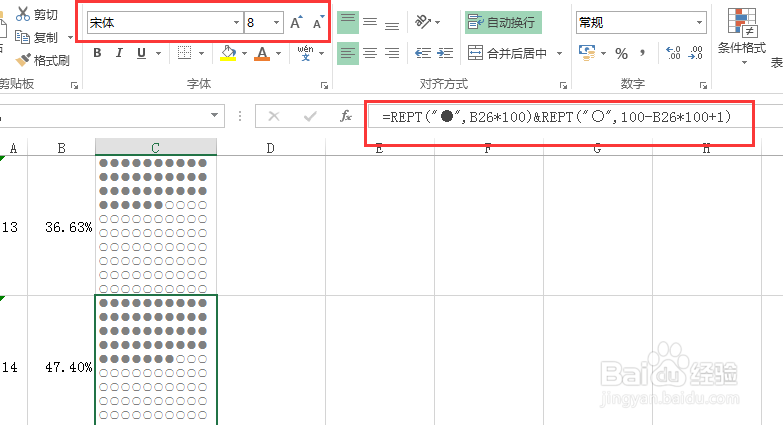
1、使用rept函数做其他图形。
可以使用不同的符号绘制不同的图形。比Excel自带的图表更加多样化。
如果加上其他的表格技巧,简直就要把rept函数玩儿坏了。
阅读量:104
阅读量:34
阅读量:152
阅读量:103
阅读量:194
1、如何使用repth函数做柱形图。
在C列输入下图中的公式,然后设置字体。
2、如果你想达到下图的效果
3、先按行输入下图公式,然后设置字体格式
4、然后设置单元格格式-对齐-文本方向设置为90度
1、使用rept函数做其他图形。
可以使用不同的符号绘制不同的图形。比Excel自带的图表更加多样化。
如果加上其他的表格技巧,简直就要把rept函数玩儿坏了。