Python绘制三维图
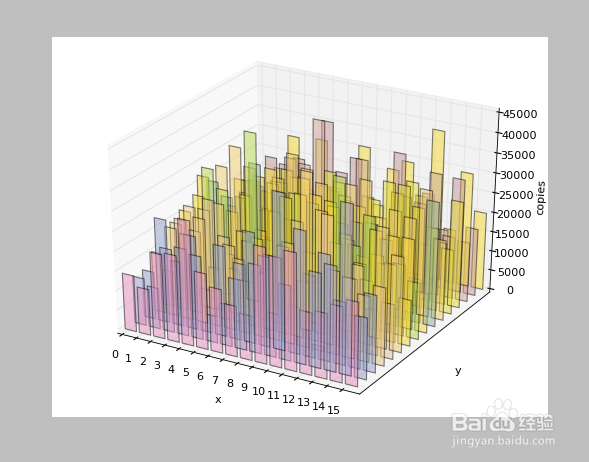
1、绘制3D柱状图,其数据格式为,二维数组或三维数组。
from numpy import *
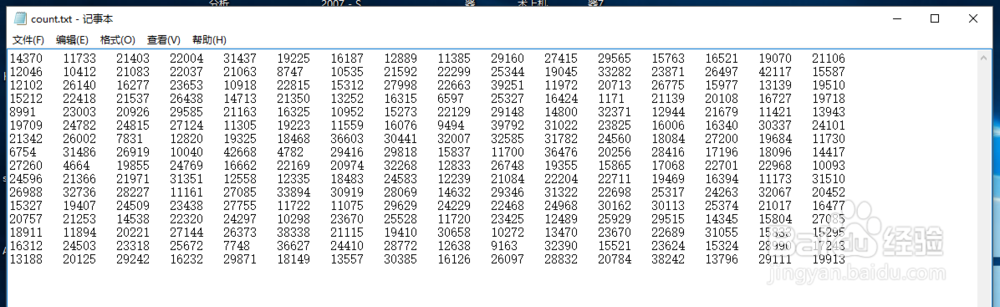
file=open('C:\\Users\\jyjh\\Desktop\\count.txt','r')
arr=[]
for i in file.readlines():
temp=[]
for j in i.strip().split('\t'):
temp.append(float(j))
arr.append(temp)
import random
import numpy as np
import matplotlib as mpl
import matplotlib.pyplot as plt
from mpl_toolkits.mplot3d import Axes3D
mpl.rcParams['font.size']=10
fig=plt.figure()
ax=fig.add_subplot(111,projection='3d')
xs=range(len(arr))
ys=range(len(arr[0]))
for z in range(len(arr)):
xs=range(len(arr))
ys=arr[z]
color=plt.cm.Set2(random.choice(range(plt.cm.Set2.N)))
ax.bar(xs,ys,zs=z,zdir='y',color=color,alpha=0.5)
ax.xaxis.set_major_locator(mpl.ticker.FixedLocator(xs))
ax.yaxis.set_major_locator(mpl.ticker.FixedLocator(ys))
ax.set_xlabel('x')
ax.set_ylabel('y')
ax.set_zlabel('copies')
plt.show()
通过设置xs,ys,z可以设定绘制不同维度的数据。

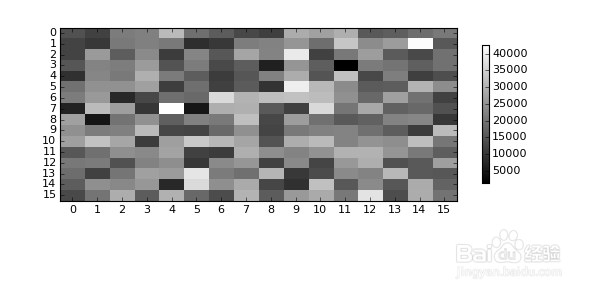
2、绘制热图:
import numpy as np
from matplotlib import pyplot as plt
from matplotlib import cm
from matplotlib import axes
def draw_heatmap(data,xlabels,ylabels):
#cmap = cm.get_cmap('rainbow',1000)
cmap=cm.gray
figure=plt.figure(facecolor='w')
ax=figure.add_subplot(2,1,1,position=[1,1,1,1])
ax.set_yticks(range(len(ylabels)))
ax.set_yticklabels(ylabels)
ax.set_xticks(range(len(xlabels)))
ax.set_xticklabels(xlabels)
vmax=data[0][0]
vmin=data[0][0]
for i in data:
for j in i:
if j>vmax:
vmax=j
if j<vmin:
vmin=j
map=ax.imshow(data,interpolation='nearest',cmap=cmap,aspect='auto',vmin=vmin,vmax=vmax)
cb=plt.colorbar(mappable=map,cax=None,ax=None,shrink=0.8)
plt.show()
xl=range(16)
yl=range(16)
draw_heatmap(arr,xl,yl)

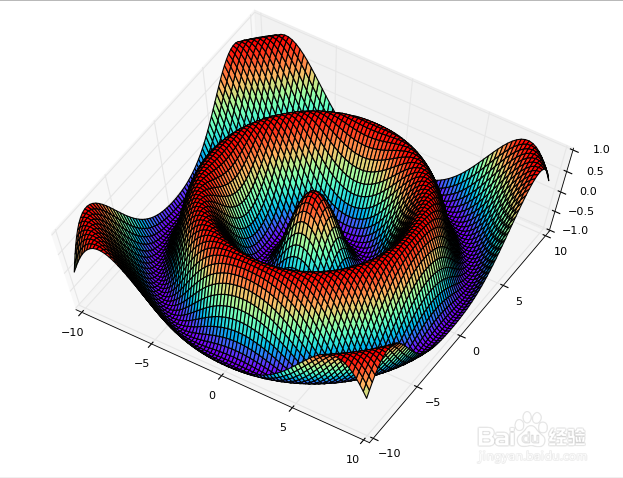
3、绘制曲面图
from matplotlib import pyplot as plt
import numpy as np
from mpl_toolkits.mplot3d import Axes3D
figure = plt.figure()
ax = Axes3D(figure)
X = np.arange(-10, 10, 0.25)
Y = np.arange(-10, 10, 0.25)
#网格化数据
X, Y = np.meshgrid(X, Y)
R = np.sqrt(X**2 + Y**2)
Z = np.cos(R)
ax.plot_surface(X, Y, Z, rstride=1, cstride=1, cmap='rainbow')
plt.show()

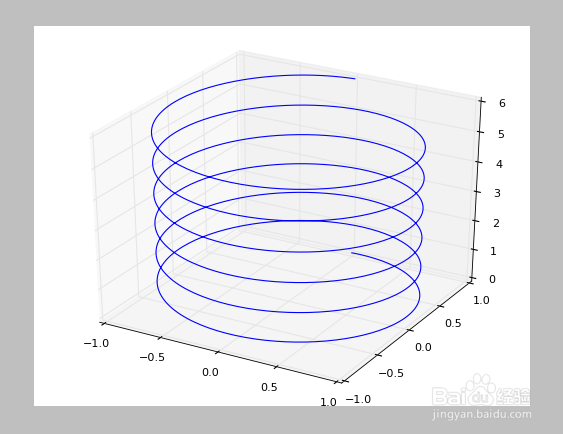
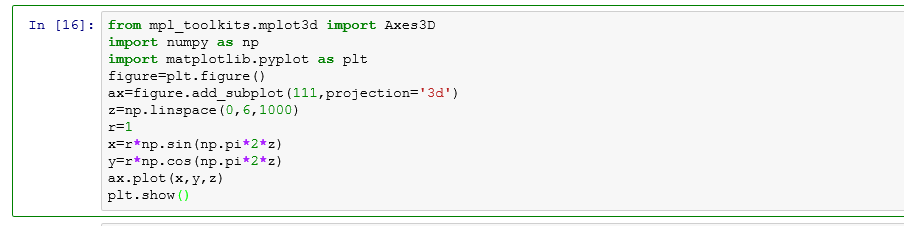
4、绘制曲线图
from mpl_toolkits.mplot3d import Axes3D
import numpy as np
import matplotlib.pyplot as plt
#生成画布
figure=plt.figure()
ax=figure.add_subplot(111,projection='3d')
#生成向量
z=np.linspace(0,6,1000)
r=1
x=r*np.sin(np.pi*2*z)
y=r*np.cos(np.pi*2*z)
ax.plot(x,y,z)
plt.show()